


How to Calculate CAC and LTV for B2B SaaS
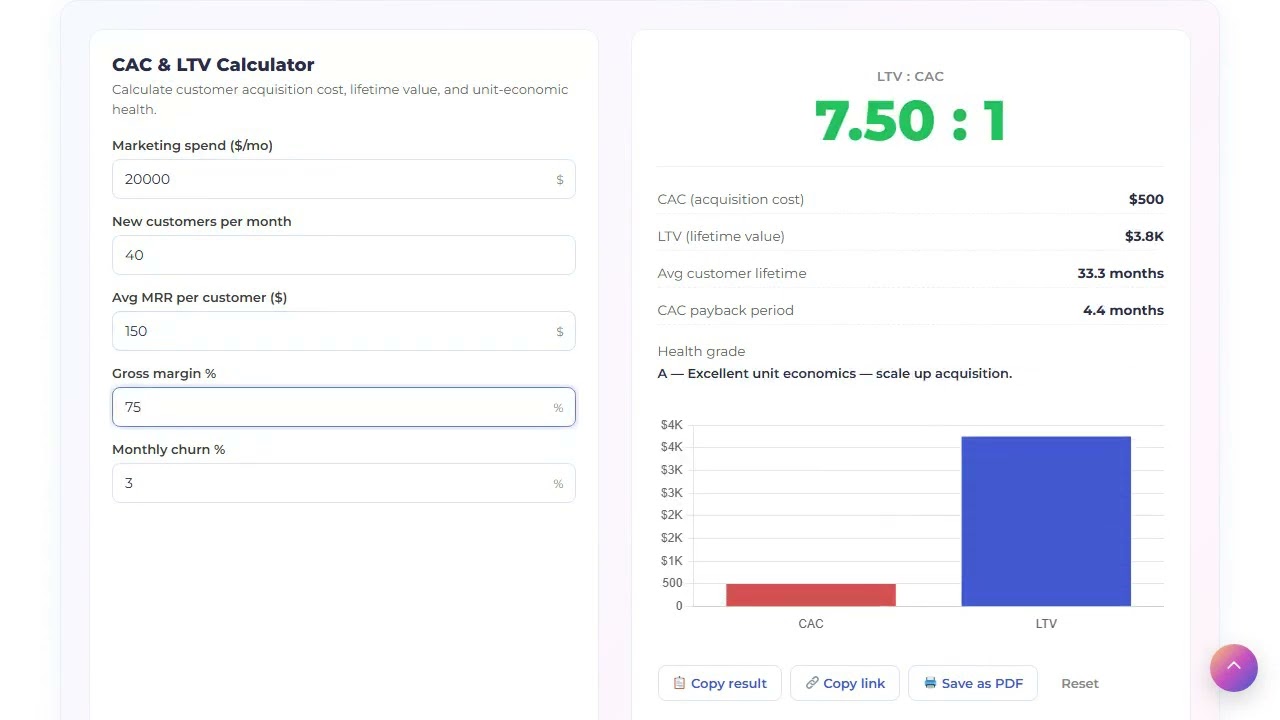
Customer acquisition cost, lifetime value, the LTV:CAC ratio, the payback period, and an A–D health grade — in one panel. Used by our team before recommending paid-channel spend to clients.
CAC and LTV formulas — and why the ratio matters more than either number
To calculate CAC and LTV you need five numbers: monthly marketing spend, new customers acquired that month, average MRR per customer, gross margin %, and monthly revenue churn %. The two formulas are intentionally simple — what changes everything is looking at them as a LTV:CAC ratio, not in isolation.
The formulas
CAC                    = marketing_spend / new_customers
avg_lifetime_months    = 1 / monthly_churn
LTV                    = mrr_per_customer × gross_margin × avg_lifetime_months
LTV:CAC ratio          = LTV / CAC
CAC payback (months)   = CAC / (mrr_per_customer × gross_margin)
The grade — what investors and operators actually look at
- A — ratio ≥ 5:1. Excellent. You are likely underspending on acquisition. Scale.
- B — ratio ≥ 3:1. Healthy. Sustainable growth, room to optimize CAC further.
- C — ratio ≥ 1.5:1. Marginal. Fix lifetime value (retention, expansion) before scaling spend.
- D — ratio < 1.5:1. Unprofitable cohort. Acquiring more customers makes things worse, not better. Fix churn or pricing before touching the funnel.
The reason the LTV:CAC ratio matters more than either number alone is that you can have a "cheap" CAC and still be unprofitable if customers churn in three months. And you can have what looks like an expensive CAC and still be healthy if lifetime value is high enough. The ratio is what compounds.
Common mistakes the calculator avoids
- Forgetting gross margin — Raw MRR × lifetime over-states LTV by 25–40 % for SaaS with hosting and support costs.
- Using annual churn — Convert to monthly first, or the lifetime calculation breaks.
- Ignoring payback period — A 5:1 ratio with 36-month payback is a cash-flow problem. The calculator surfaces payback explicitly.
How to calculate CAC and LTV step by step
All five inputs come from your CRM or finance system. Numbers from the last full month work best.
Pull monthly marketing spend
All-in: paid media, content, agency fees, tools, share of allocated salaries. If you under-count, CAC looks artificially low.
Count new paying customers
Only paying, only new in that month. Free trials and reactivations do not count.
Average MRR per new customer
Average across this month's new cohort. Do not use blended ARPU from all customers — it lags reality.
Set gross margin and churn
Gross margin = revenue minus COGS (hosting, support, payment fees). Monthly churn = lost MRR / start-of-month MRR.
Read the ratio and the grade
Below B (3:1)? Do not increase marketing spend until retention or pricing improves. Above A (5:1)? You can probably afford to spend more on acquisition.
Frequently asked questions about CAC and LTV
3:1 is the industry-standard floor for sustainable growth; 5:1 is considered excellent and may indicate you are under-spending on acquisition. Below 1.5:1 the cohort is unprofitable and acquiring more customers makes the situation worse, not better.
Gross revenue × gross margin %. Using raw revenue overstates LTV by 25–40 % for typical SaaS with hosting and support costs. The calculator forces you to enter gross margin so you cannot skip this step.
monthly_churn = 1 − (1 − annual_churn)^(1/12). For 30 % annual churn, monthly is about 2.95 %. Always use monthly in this calculator — annual churn breaks the lifetime formula.
Under 12 months is healthy for B2B SaaS; under 18 months is acceptable; over 24 months indicates a cash-flow problem even if the LTV:CAC ratio looks fine. Series A / B investors typically expect under 18 months.
Most likely your monthly churn input is too low (under 1 %). For self-serve SaaS, monthly churn is rarely below 2 %; for SMB SaaS, 4–6 % is normal. Recheck the input — high LTV with low churn is the most common modelling artifact.
This base version does not. If your net revenue retention is over 100 %, real LTV is higher than what the calculator shows — by roughly NRR / (1 − NRR). Treat the result as a conservative floor.