


How to Calculate A/B Test Sample Size
How many visitors per variant do you need to detect a real lift? The two-proportion z-test below gives you the exact number — and how many days to run the test at your current traffic.
How A/B test sample size is calculated
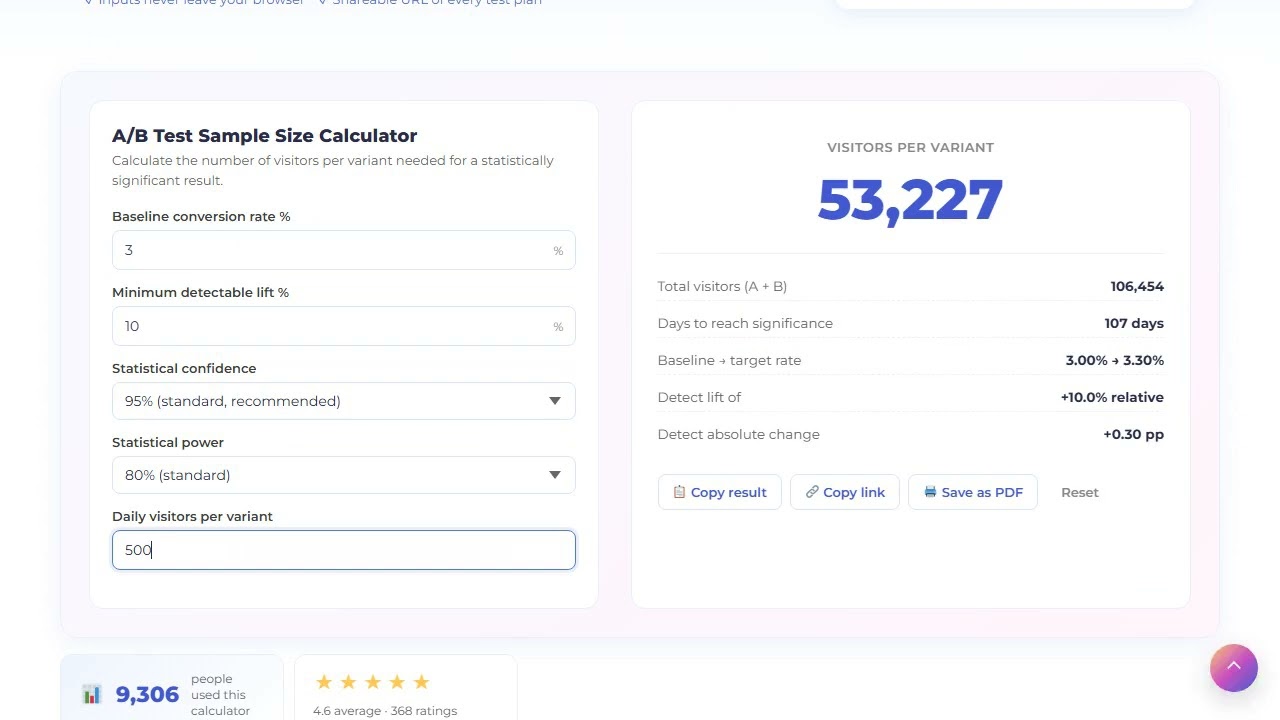
To calculate A/B test sample size you need five inputs: baseline conversion rate, minimum detectable lift, confidence level, statistical power, and your daily visitor count per variant. The calculator uses the same two-proportion z-test that Optimizely, VWO and Convert use under the hood.
The formula
p1   = baseline                              # current conversion rate
p2   = baseline × (1 + minimum_lift)         # what you want to detect
p̄   = (p1 + p2) / 2                          # pooled probability
n    = (zα × √(2p̄(1-p̄)) + zβ × √(p1(1-p1) + p2(1-p2)))² / (p2 - p1)²
Where zα is the z-score for your confidence level (1.96 for 95 %), and zβ is the z-score for your statistical power (0.842 for 80 % power). Both are precomputed for the common pairs.
What each input means in plain English
- Baseline conversion rate — current rate the variant is fighting against. Use the rate from the last 30 days, not all-time.
- Minimum detectable lift — the smallest relative change worth caring about. 10 % is typical for marketing tests; 5 % for revenue tests. Setting it too small (1–2 %) makes sample size balloon.
- Confidence — 1 minus the chance of a false positive. 95 % is the default; 99 % is for high-stakes decisions; 90 % is acceptable for low-risk marketing optimizations.
- Power — chance of detecting a real lift if it exists. 80 % is standard; 90 % for sensitive tests where missing the lift is costly.
- Daily traffic per variant — used to compute how many days to run the test. Half of total daily visitors if you split 50/50.
Common mistakes the calculator avoids
- Stopping early — looking at significance before reaching sample size inflates false positives. The calculator shows the exact threshold.
- Setting MDE too small — a 1 % lift on a 3 % baseline needs 100k+ visitors per variant. Most teams cannot afford that runtime.
- Forgetting power — 95 % confidence with 50 % power means half your real wins will look like noise.
How to plan an A/B test with this calculator
Plan the sample size before you ship the test, not after.
Measure baseline conversion
Use the rate from the last 30 days for the surface you are testing. Do not use 90-day or all-time — it does not reflect current behavior.
Decide minimum detectable lift
Pick the smallest lift that would change your decision. 10 % relative is typical for marketing; 5 % for revenue; do not go below 5 % without 100k+ visitors.
Pick confidence and power
95 % / 80 % is standard. Go to 99 % / 90 % for high-stakes tests. Anything looser is fine for low-risk optimizations but document the decision.
Enter daily traffic per variant
Total daily visitors to the test surface, divided by number of variants. The calculator outputs days to significance.
Lock the runtime, do not stop early
Run the test for the full duration. Peeking at significance halfway inflates false positives by 2–3x. Trust the calculator.
Frequently asked questions about A/B test sample size
95 % is the industry standard and the right default for most marketing tests. 99 % for high-stakes tests (pricing, checkout flow) where a wrong call costs real money. 90 % is acceptable for low-risk optimizations like headline tweaks.
Run until you hit the sample size the calculator shows — never less. Minimum runtime should also span at least one full business cycle (7 days for B2B, 14 days for SaaS with weekly buyers) so you capture day-of-week effects.
Confidence = chance the result is not a fluke (typically 95 %). Power = chance you will detect a real lift if it exists (typically 80 %). You need both — a high-confidence, low-power test misses real wins.
Sample size scales inversely with the square of the lift. Halving the detectable lift quadruples the required sample size. This is why detecting a 2 % lift on a 3 % baseline typically needs 100k+ visitors per variant — there is no shortcut.
No. Peeking and stopping early inflates the false-positive rate from 5 % up to 25–30 % in repeated peeking. If you must monitor, use sequential testing methods (mSPRT, group sequential) — but this simple calculator assumes a fixed-horizon test.
Not directly — this version is a two-proportion z-test (A vs B only). For multi-arm tests, increase the per-variant sample size by ~50 % to account for the Bonferroni correction across pairwise comparisons.