


NPS Calculator
Net Promoter Score = % promoters − % detractors. Includes benchmarks for B2B SaaS, B2C, and verdict.
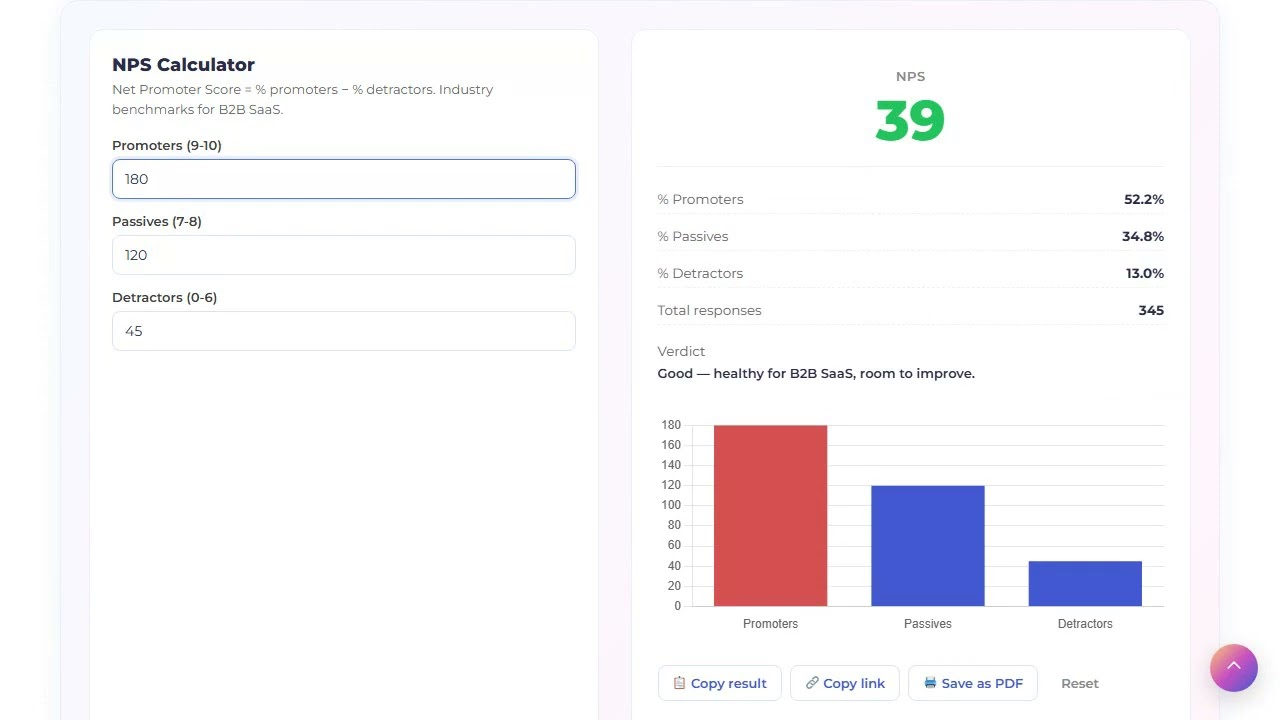
NPS — formula and benchmarks
NPS (Net Promoter Score) measures customer loyalty on a scale from −100 to +100. The formula: percentage of promoters (9-10 rating) minus percentage of detractors (0-6 rating). It is the most-tracked customer-loyalty metric, used in 70%+ of SaaS dashboards.
The formula
NPS = % promoters (9-10) − % detractors (0-6)

# Total respondents = promoters + passives + detractors
# Passives (7-8) count toward total but not toward score
What healthy numbers look like
- ≥70: World-class. Apple, Tesla, top SaaS.
- 50-70: Excellent. Strong PMF signal.
- 30-50: Good. Typical healthy B2B SaaS range.
- 0-30: Below average. Read detractor feedback urgently.
- Negative: More detractors than promoters. Major issue.
Common mistakes the calculator avoids
- Comparing NPS across industries — B2B SaaS averages 36, telecom averages 0.
- Surveying only happy customers — sample bias inflates NPS by 20-40 points.
- Ignoring response rate — NPS from 5% response rate is noise.
- Not segmenting — promoters in your free tier mean nothing if all detractors are paid.
How to use this calculator
Three input counts from your NPS survey. Verdict is automatic.
Run the NPS survey
One question: "On a scale of 0-10, how likely are you to recommend us?" Send to representative sample, not just happy customers.
Bucket responses
9-10 = promoters. 7-8 = passives. 0-6 = detractors. Do not move the cutoffs.
Count each bucket
Enter the counts. Total is auto-summed.
Read NPS + verdict
Compare to industry benchmark. Investigate detractor feedback first — that is where you find action.
Track over time
NPS is most useful as a trend. Quarterly cadence is standard.
Frequently asked questions
NPS = % promoters (9-10) − % detractors (0-6). The 7-8 group (passives) does not count toward the score but counts toward the total. NPS ranges from −100 (all detractors) to +100 (all promoters).
30+ is healthy. 50+ is excellent. 70+ is world-class. Industry mean for B2B SaaS is 36; B2C subscription is 22. Compare against your own segment, not blanket industry averages.
Because they are satisfied but not enthusiastic — they will not actively recommend you but will not actively complain either. NPS measures recommendation intent specifically. The 7-8 bucket is "fine" and not predictive of action.
Quarterly for relationship NPS (existing customers). After key milestones (onboarding, support resolution, renewal) for transactional NPS. Monthly is too frequent and causes survey fatigue.
20-40% is healthy for in-product NPS. Email-only typically gets 5-15%. Below 10% the score is noisy — try in-app prompts to lift response rate.
Detractors (0-6) are 3-5× more likely to churn than promoters. NPS itself is weak as a churn predictor — segment-level NPS + individual responses are better. Always read the verbatim feedback, not just the score.