


Engagement Rate Calculator
Likes + comments + shares ÷ reach. Plus platform-specific benchmarks for Instagram, TikTok, LinkedIn, X, YouTube, Facebook.
Engagement Rate — formula and benchmarks
Engagement rate measures how actively your audience interacts with content relative to reach. It is the single most-tracked social-media KPI — and the one most often calculated wrong because platforms use different denominators (followers vs reach vs impressions).
The formula
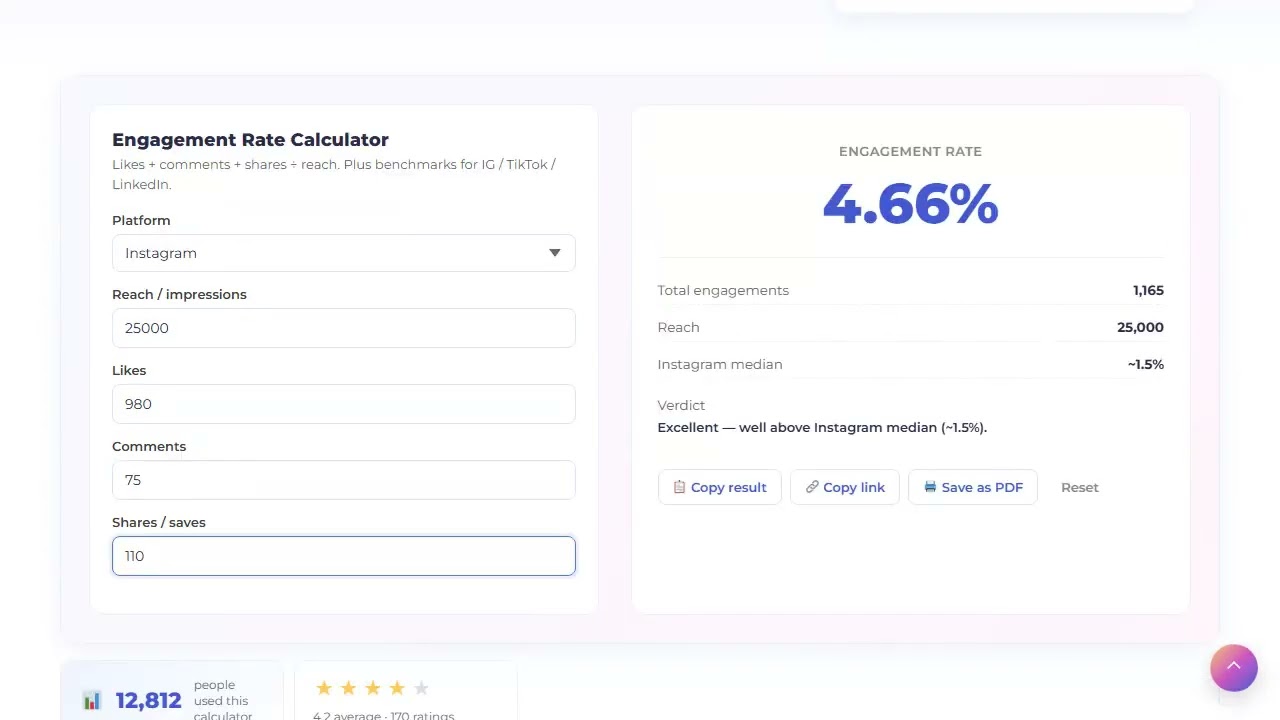
Engagement rate = (likes + comments + shares) / reach × 100%

# Some teams use followers as denominator — gives a different number.
# This calculator uses reach (most accurate for organic content).
What healthy numbers look like
- Instagram: 1.5% median (2024).
- TikTok: 5.7% median.
- LinkedIn: 2.0% median for sponsored, ~3% for organic personal.
- X / Twitter: 0.5% median.
- YouTube: 1.6% median (likes + comments / views).
- Facebook: 0.27% median.
Common mistakes the calculator avoids
- Comparing engagement across platforms — different denominators and norms.
- Using followers instead of reach — overstates by 2-5×.
- Forgetting saves on Instagram — they count as engagement and Instagram weights them heavily.
- Tracking only one post — single-post engagement is noisy. Use 30-day average.
How to use this calculator
Five inputs from your platform analytics. Verdict adjusts by platform.
Pick the platform
Benchmarks vary 10× across platforms. Picking the right one matters.
Pull reach
Unique accounts that saw the content. Use reach, not impressions (impressions count repeat views).
Sum likes + comments + shares
On Instagram, include saves. On TikTok, include shares + duets. On LinkedIn, include reposts.
Read engagement rate + verdict
Above benchmark = healthy. Far below = content fit or audience targeting issue.
Track 30-day average
Single posts are noisy. The trend over 30 days is the real signal.
Frequently asked questions
Engagement rate = (likes + comments + shares) / reach × 100%. Some teams use impressions or followers as denominator — but reach is most accurate for organic content. This calculator uses reach.
1-3% is healthy. 5%+ is excellent. The 2024 median is 1.5%. Above 3% usually signals strong creator-audience fit; under 0.5% suggests either bot followers or content that does not match the audience.
Different user behaviors and algorithms. TikTok's "For You" page surfaces content to non-followers, lifting engagement-rate denominator behavior. LinkedIn shows posts to a tighter graph. X has high impression-to-engagement gap. Always compare within platform.
Reach (unique accounts) is more accurate. Impressions counts repeat views, which deflates engagement rate artificially. Some platform dashboards default to impressions — switch to reach when possible.
Yes — and Instagram's algorithm weights them heavily. Saves indicate content has long-term value (saved for later). Include saves in your engagement count, especially for educational or how-to content.
Three usual reasons: audience growth outpaced quality (bigger, more diluted audience), content fatigue (same format), or platform algorithm change. Run an A/B on content format + posting cadence before assuming algorithm.